Traefik HTTP router for Docker
Table of Contents
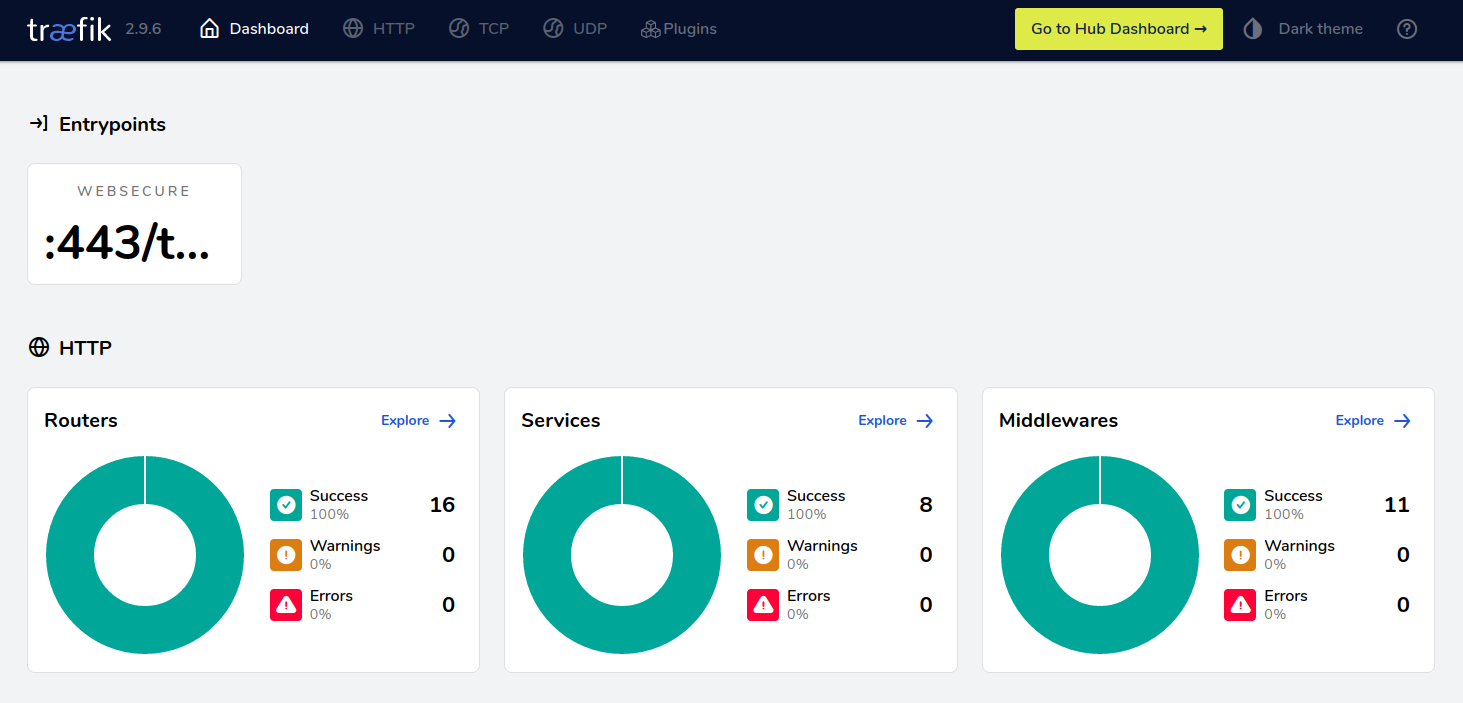
Figure 1: Traefik web interface
Introduction
Traefik is an open-source Edge Router 1. It can act as a HTTP router as well as a proxy for TCP and UDP services. In many ways, it is equivalent to Nginx; however, Traefik is more easy to integrate with container back-ends such as Docker.
Traefik is a rather young project squarely aimed at those running their applications in orchestrated containers. It’s a load balancer that goes hand in hand with service discovery methods and tools, reload-less reconfiguration, modern metrics and monitoring, all the goodies that are essential when behind a nice frontend may hide hundreds of small (should I say micro?) services. 2
In this post I show how one might integrate Traefik with Docker. I also provide a default configuration file that integrates with Cloudflare and Lets Encrypt.
Setting up Traefik inside a Docker container
The following configuration was taken from a swarm environment. The Traefik container must
be connected to an overlay network - here it is called traefik_public. Containers that
wish to expose their services to Traefik must connect to this network.
version: "3.9"

networks:
  traefik_public:
    name: "traefik_public"
    driver: "overlay"

services:
  traefik:
    image: "traefik:latest"
    networks:
      - "traefik_public"
    ports:
      - target: 443
        published: 443
        protocol: "tcp"
        mode: "host"
    volumes:
      - "/home/ingress/mount:/etc/traefik"
      - "/var/run/docker.sock:/var/run/docker.sock"
    environment:
      - "CLOUDFLARE_EMAIL=<your email address>"
      - "CLOUDFLARE_API_KEY=<your api key>"
    deploy:
      mode: "replicated"
      restart_policy:
        condition: "on-failure"
      placement:
        constraints:
          - "node.hostname==<web server hostname>"
I have made the following assumptions:
- You are using Docker swarm
- You are using Cloudflare and have already created an API key
- The container will mount
/home/ingress/mounton the host - Traefik will listen on 443/tls ONLY - not 80. You can setup HTTP -> HTTPS redirects with Cloudflare
Exposing a container
Exposing a service is as simple as assigning labels to a container. Create a compose
file with a labels section and add traefik.* key=value pairs.
networks:
  traefik_public:
    external: true

...

networks:
  - "traefik_public"
deploy:
  mode: "replicated"
  labels:
    # traefik
    - "traefik.enable=true"
    - "traefik.docker.network=traefik_public"
    # http (your-domain.net)
    - "traefik.http.routers.wordpress.entrypoints=websecure"
    - "traefik.http.routers.wordpress.rule=Host(`your-domain.net`)"
    - "traefik.http.routers.wordpress.tls.certresolver=letsencrypt"
    - "traefik.http.routers.wordpress.service=wordpress"
    - "traefik.http.services.wordpress.loadbalancer.server.port=80"
  restart_policy:
    condition: "on-failure"
  placement:
    constraints:
      - "node.hostname==<web server hostname>"
The above configuration assumes a service called wordpress. Traefik will request a
TLS certificate from Lets Encrypt and will forward requests to the local service
"wordpress" listening on port 80. Please see 3 for a full list of available
labels and configuration options.
A sensible configuration file
Traefik revolves around a central configuration file. You should create yours under
/home/ingress/mount/traefik.toml and add the following.
[global]
  checkNewVersion = true
  sendAnonymousUsage = false

[log]
  level = "INFO"

[api]
  dashboard = true

[accessLog]
  bufferingSize = 1024
  filePath = "/etc/traefik/access-log.json"
  format = "json"
  [accessLog.fields]
    defaultMode = "drop"
    [accessLog.fields.names]
      "Duration" = "keep"
      "ClientHost" = "keep"
      "ClientPort" = "keep"
      "RequestHost" = "keep"
      "RequestPath" = "keep"
      "RequestMethod" = "keep"
      "RequestProtocol" = "keep"
      "RequestScheme" = "keep"
      "RouterName" = "keep"

[